Wireshark is world famous widely used network protocol analyzer. It is open-source packet analyzer which is free to use. In initial stage original name of project was Ethereal later in 2006 it was renamed due to trademark issues.
What is Wireshark?
It is a network protocol analyzer . It is an application that captures packets from the network connected to wifi on your laptop, computer. Packet is a discrete unit of data in a typical Ethernet network.
It is the most often-used packet sniffer in the world. It perform do 3 things:
- Packet Capture: It listens to a network connection in real time and then grabs entire streams of traffic – quite possibly tens of thousands of packets at a time.
- Filtering: It is capable of slicing and dicing all of this random live data using filters. By applying a filter, you can obtain just the information you need to see.
- Visualization: It is like any good packet sniffer, allows you to dive right into the very middle of a network packet. It also allows you to visualize entire conversations and network streams.
Installation of Wireshark
We can install it in both Windows and Linux operating systems.
Install Wireshark in Ubuntu
sudo add-apt-repository ppa:wireshark-dev/stable
sudo apt update
sudo apt -y install wireshark
In order to capture the packets you need to add yourself to the user group and run the program in root.
sudo wiresharkFor more details go to website
https://linuxhint.com/install_wireshark_ubuntu/
Install Wireshark on Windows
Go to the mentioned website and download application from it.
https://www.wireshark.org/download.html
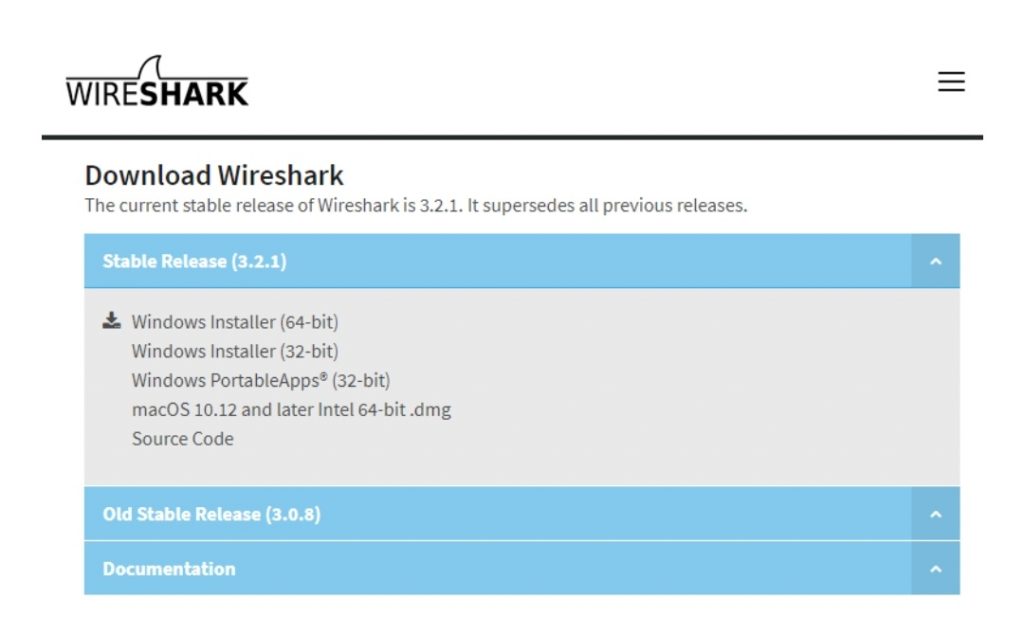
During the installation process, a prompt will appear to install Npcap and WinPcap. You need to install both these libraries because they are required to live data capture. You need to run it as an administrator to use some tools.
How to Capture Data Packets With Wireshark
As you open the application, you can capture traffic on your network by clicking the interface you wish to continue.
Once you click on the interface of the window it will start to show you real-time packet transfer. To start capturing the packets simply click on Capture> Start.
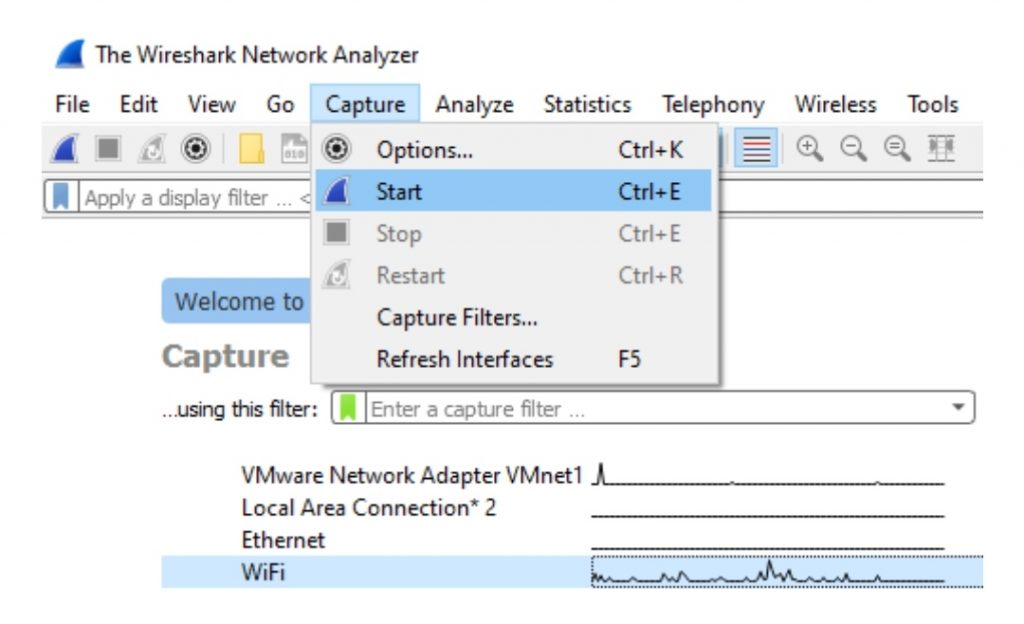
To stop packet capturing, click on the “Stop” button located at the top left corner of the window.
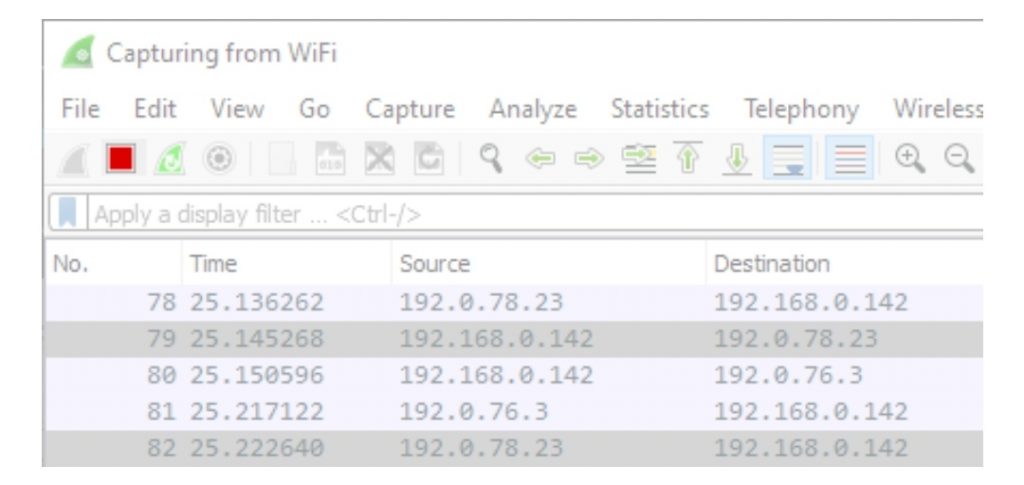
After you have captured packets in the application. The captured packets will be shown in the packet list pane. You can select a packet from packet list pane to view more details on the packet detail pane about the packets

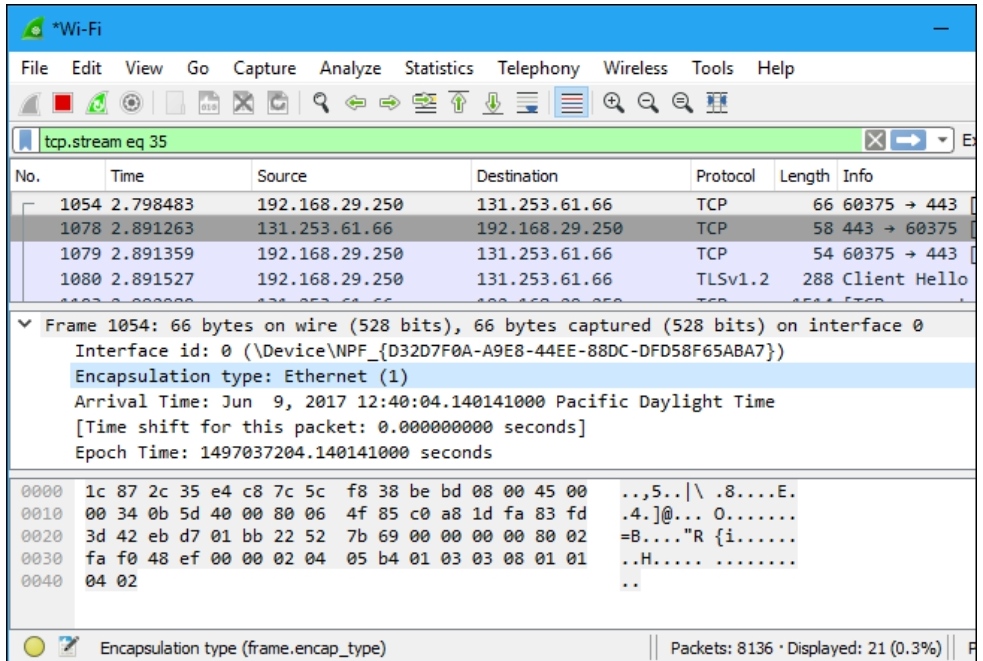
You can view each packet in different window by simply double clicking in the packet you want to detail about.
Filtering Packets
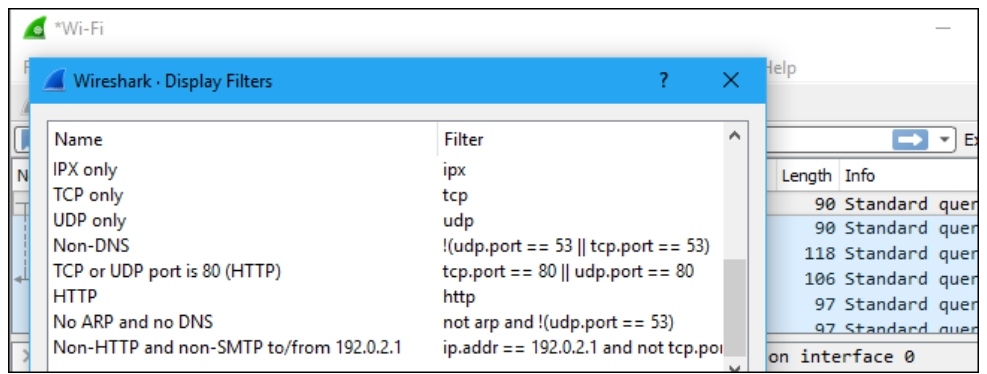
You can also click Analyze > Display. Then after this we choose a filter from among default filters. We can also add our custom filter and save them easily access them in future.
Inspecting Packets
Click to a packet and select it . You can also dig down to view it’s details.
Most Used Filters:
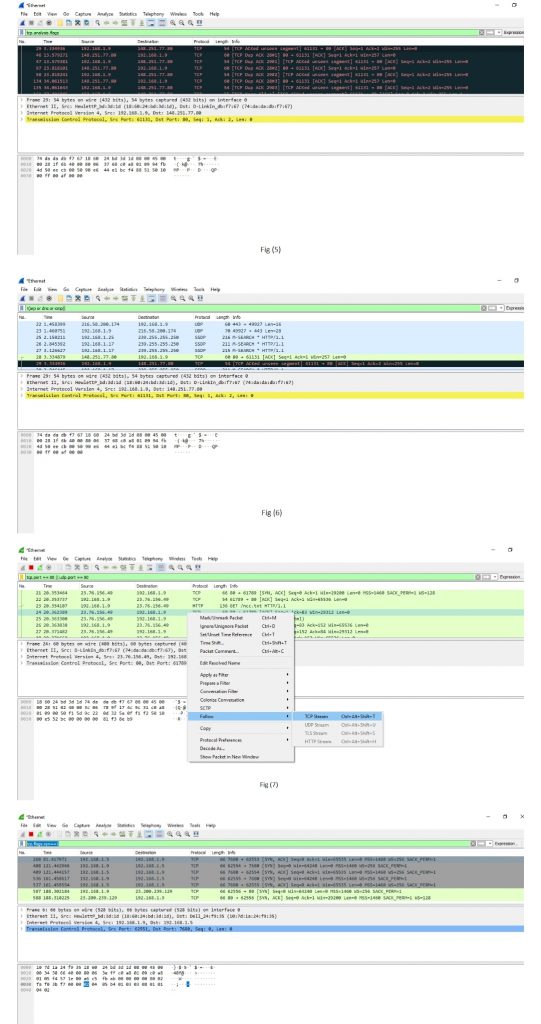
Filters Used in Wireshark
| Filters | Description |
| ip.addr Example- ip.addr==10.0.10.142 ip.src ip.dst | It is used to specify the IP address as the source or the destination.This example will filter based on this IP address as a source and a destination. |
| protocol Example- dns or http ‘Dns and http’ is never used. | This command filters based on the protocol. It requires the packet to be either dns protocol or http protocol and will display the traffic based on this. |
| tcp.port Example: tcp.port==443 | It sets filter based on the specific port number. It will filter all the packets with this port number. |
Packet sniffing
Packet sniffing is defined as the process to capture the packets of data flowing across a computer network. The Packet sniffer is a device or software that is used for the process of sniffing.
Steps for Packet Sniffing:
- Open the Wireshark Application in computer.
- Select the current interface. For example, An interface is Ethernet that we would be using.
- The network traffic will be shown below, which will be continuous. To stop or watch any particular packet , you can click on the red button below the menu bar.
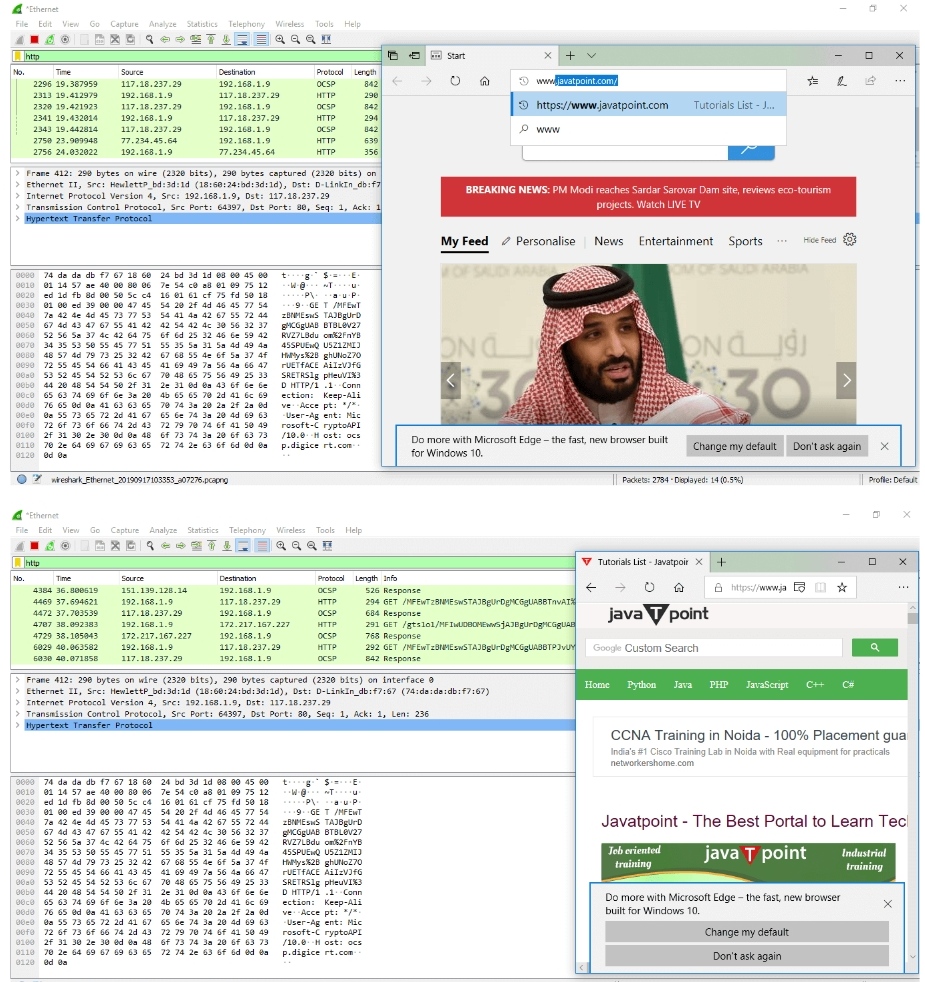
For example, we have opened the ‘Internet Explorer.’ You can choose any browser ie. Google Chrome, mozilla etc
As we open the browser, and type address of any website, the traffic will start showing in interface, and exchange of the packets will start. As shown in the figure.
How to use Color Coding?
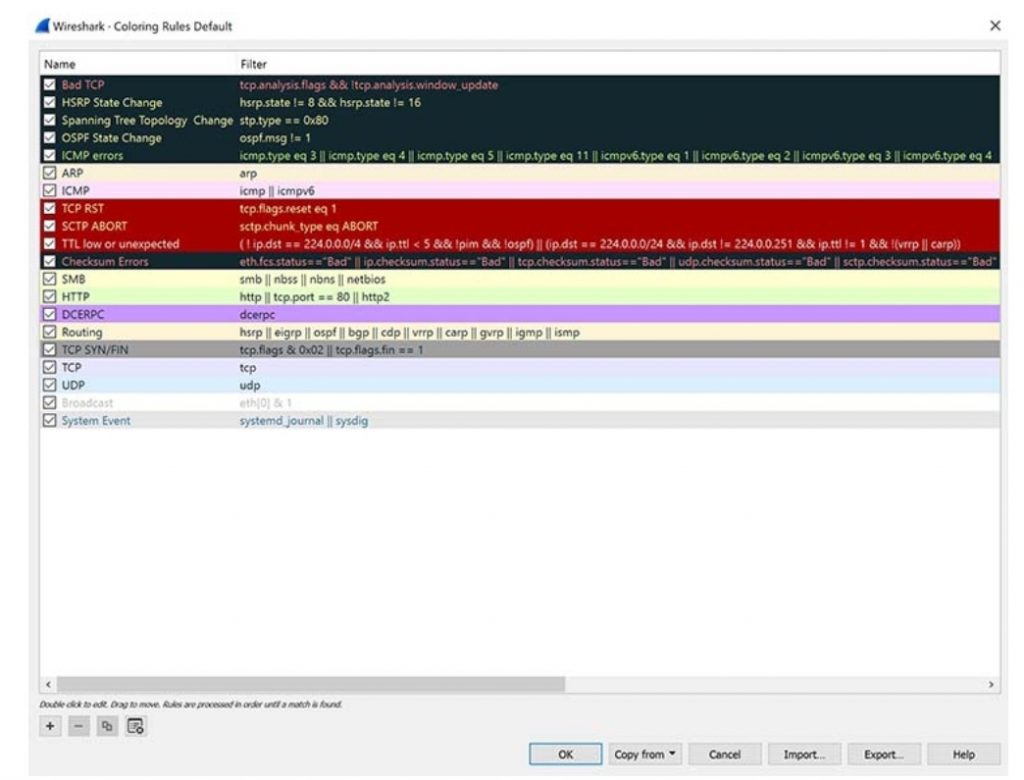
It helps you to identify packet types by applying color coding .Here we will assigning to a specific packet.
| Color in Wireshark | Packet Type |
| Light Blue | UDP |
| Black | Packet with error |
| Light green | HTTP Traffic |
| Dark yellow | Routing |
| Dark grey | TCP SYN |
The default coloring scheme as shown in figure. You can view it by going to View >> Coloring Rules.
Application of Wireshark
1.It is often used by network security engineers to examine security problems and find vulnerabilities.
2.QA engineers use it to verify network applications and give its report .
3.Developers of various organizations use it to debug protocol implementations.
4.Network administrators use Wireshark to troubleshoot network problems easily and efficiently.
The Official Website of Wireshark tool is:


